UK Train Rides Analysis

Project wall Main Dashboard power bi

Our graduation project for the Digital Egypt Pioneers Initiative (DEPI) was a comprehensive UK Train Rides Analysis. This project focused on transforming raw transportation data into clear, strategic insights to support data-driven decision-making.

We utilized a robust analytics stack to deliver the project end-to-end:

  • SQL for complex data querying, cleaning, and transformation.
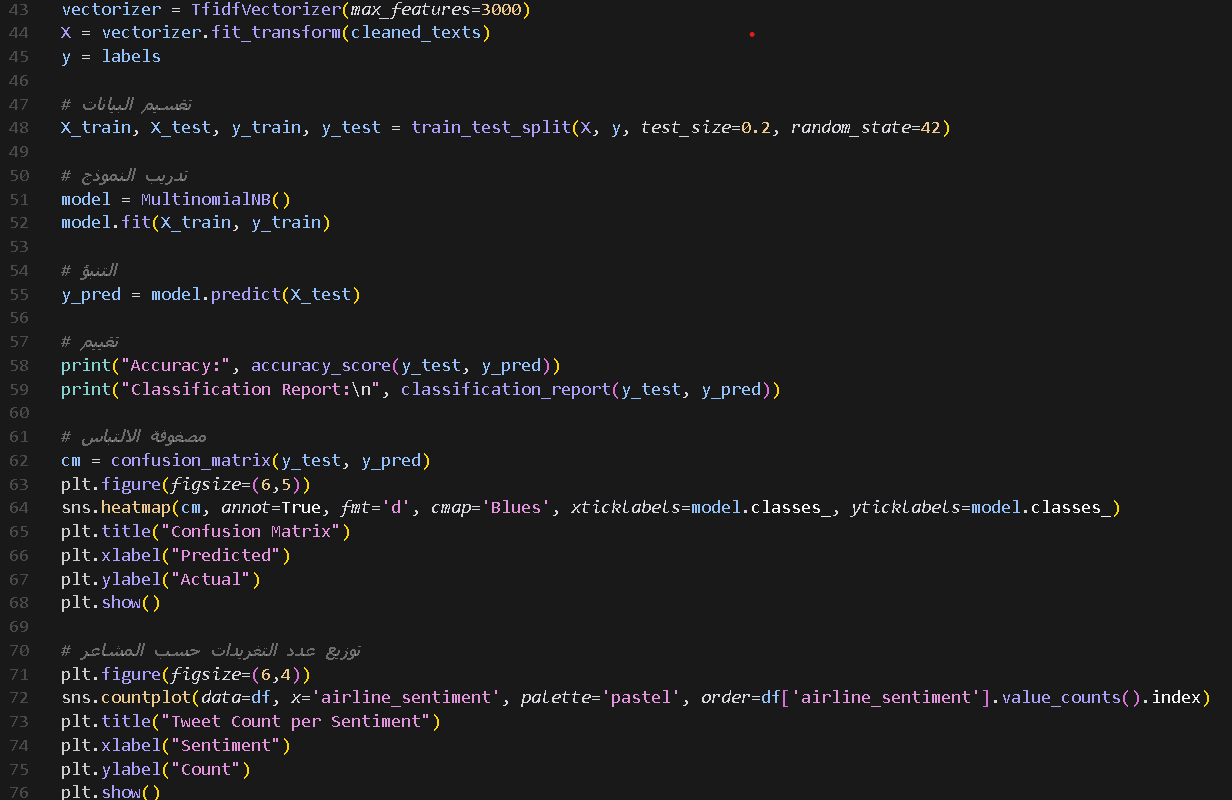
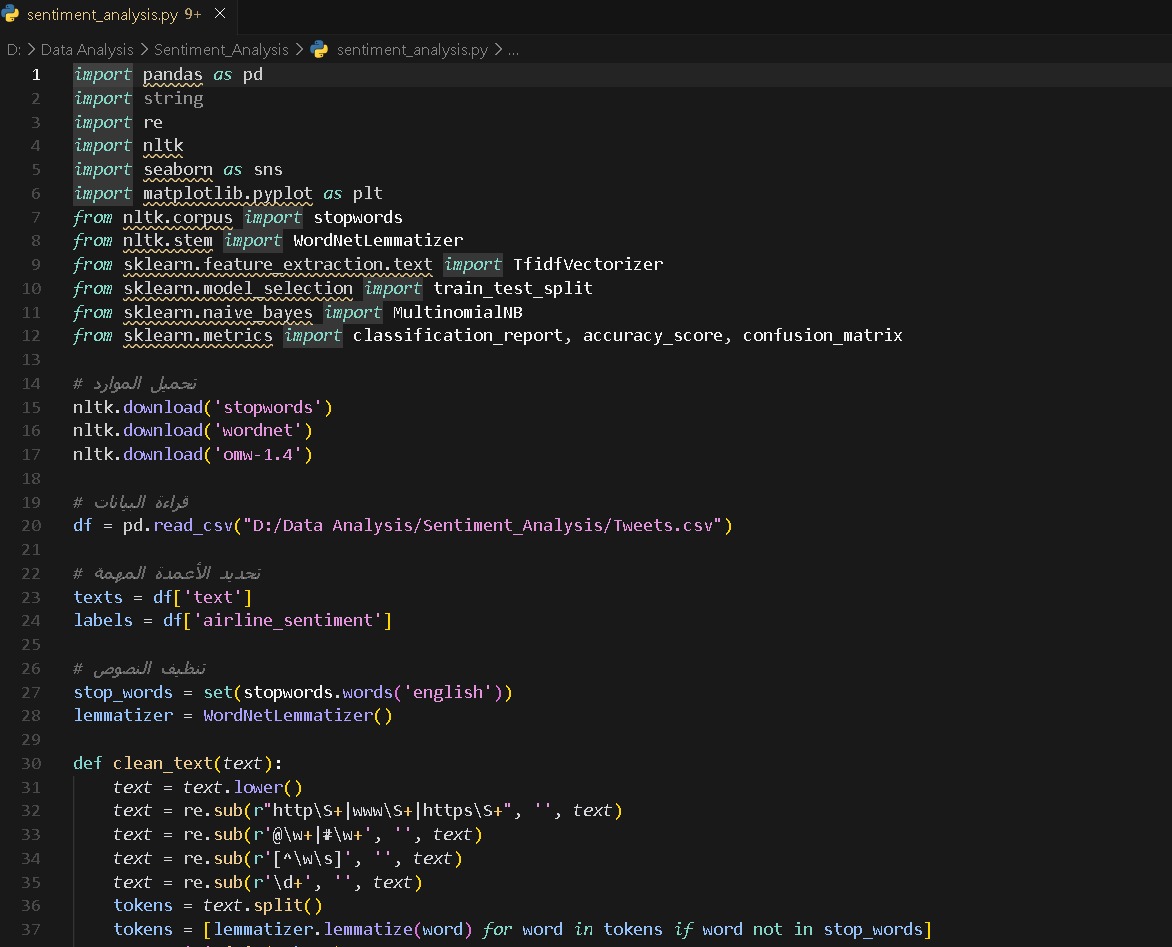
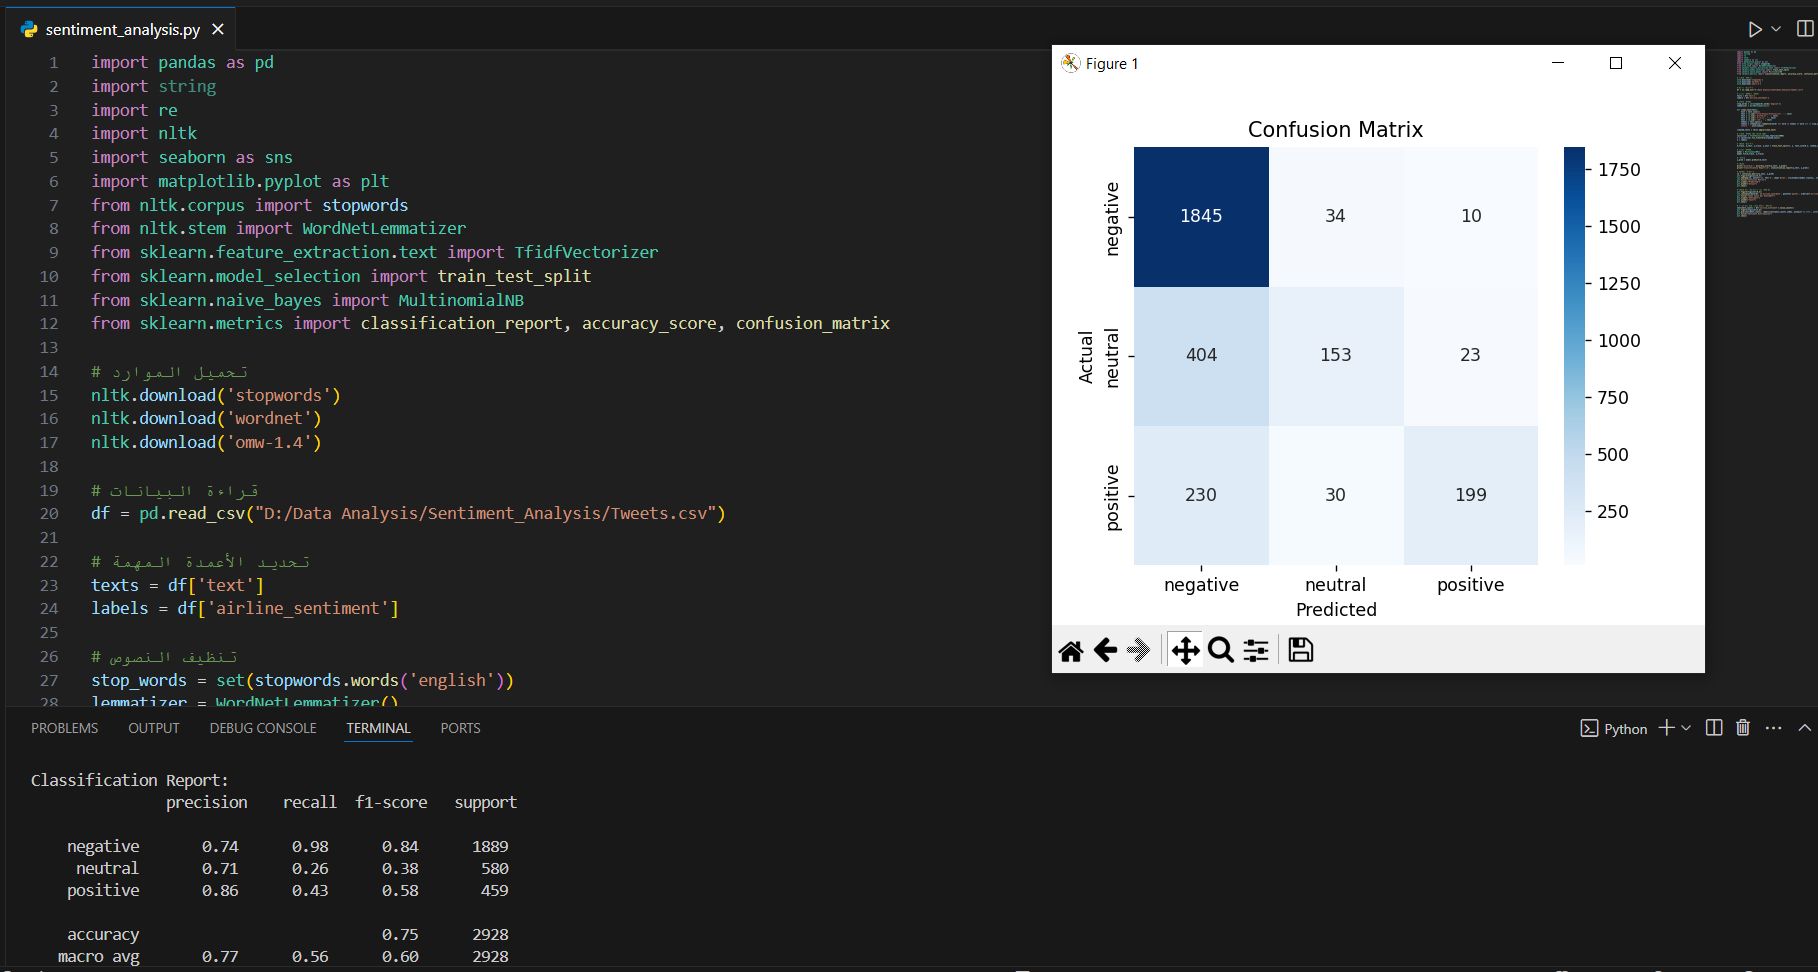
  • Python (Pandas & Matplotlib) for in-depth analysis and exploratory data visualization.
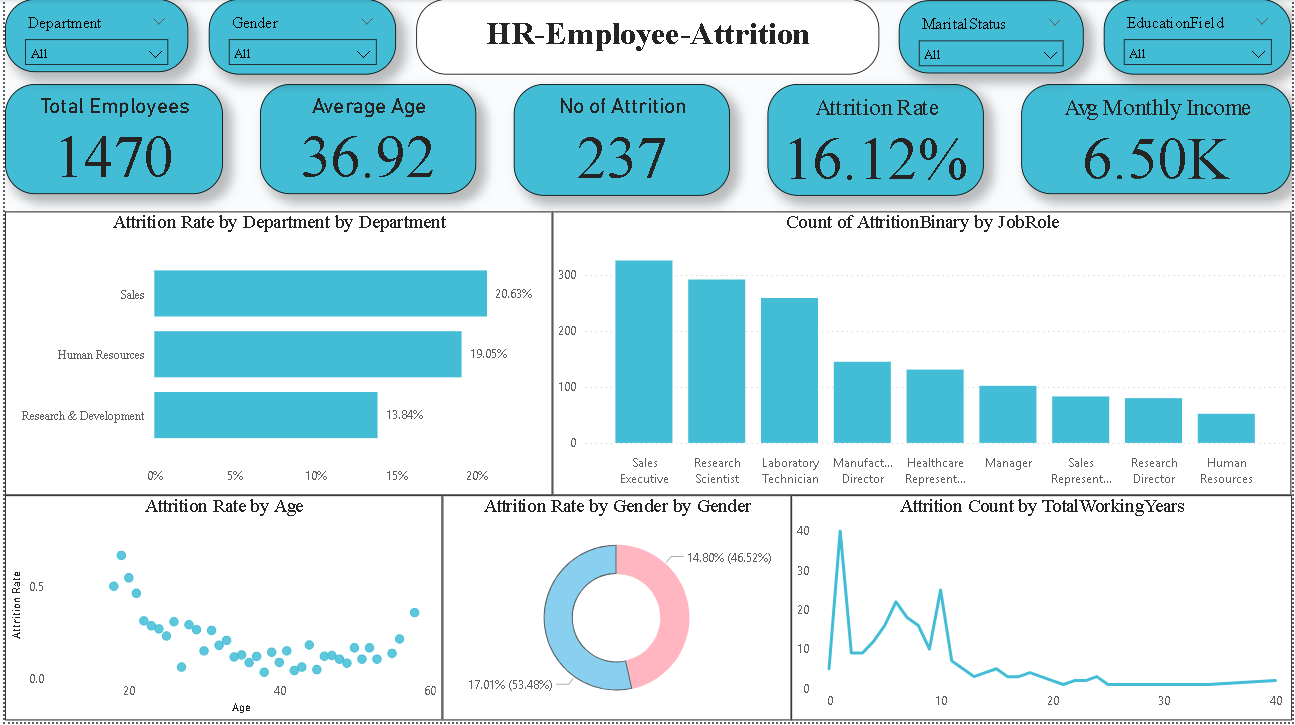
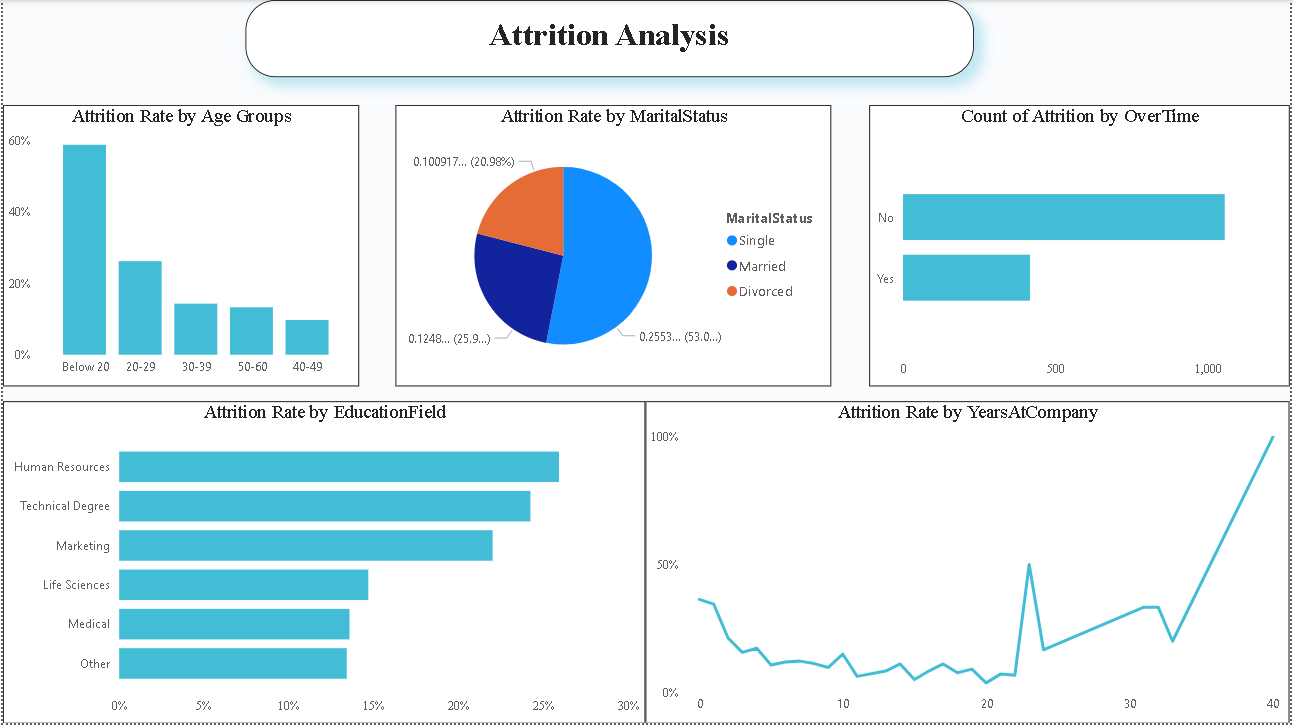
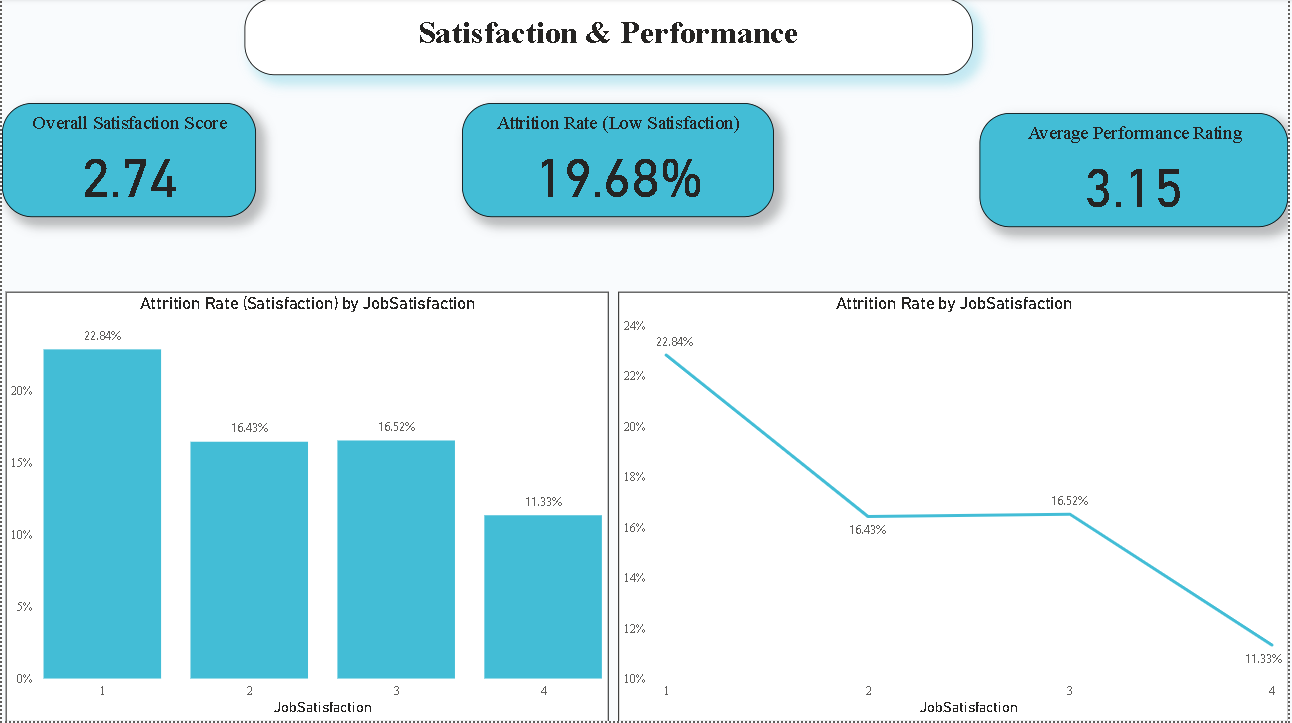
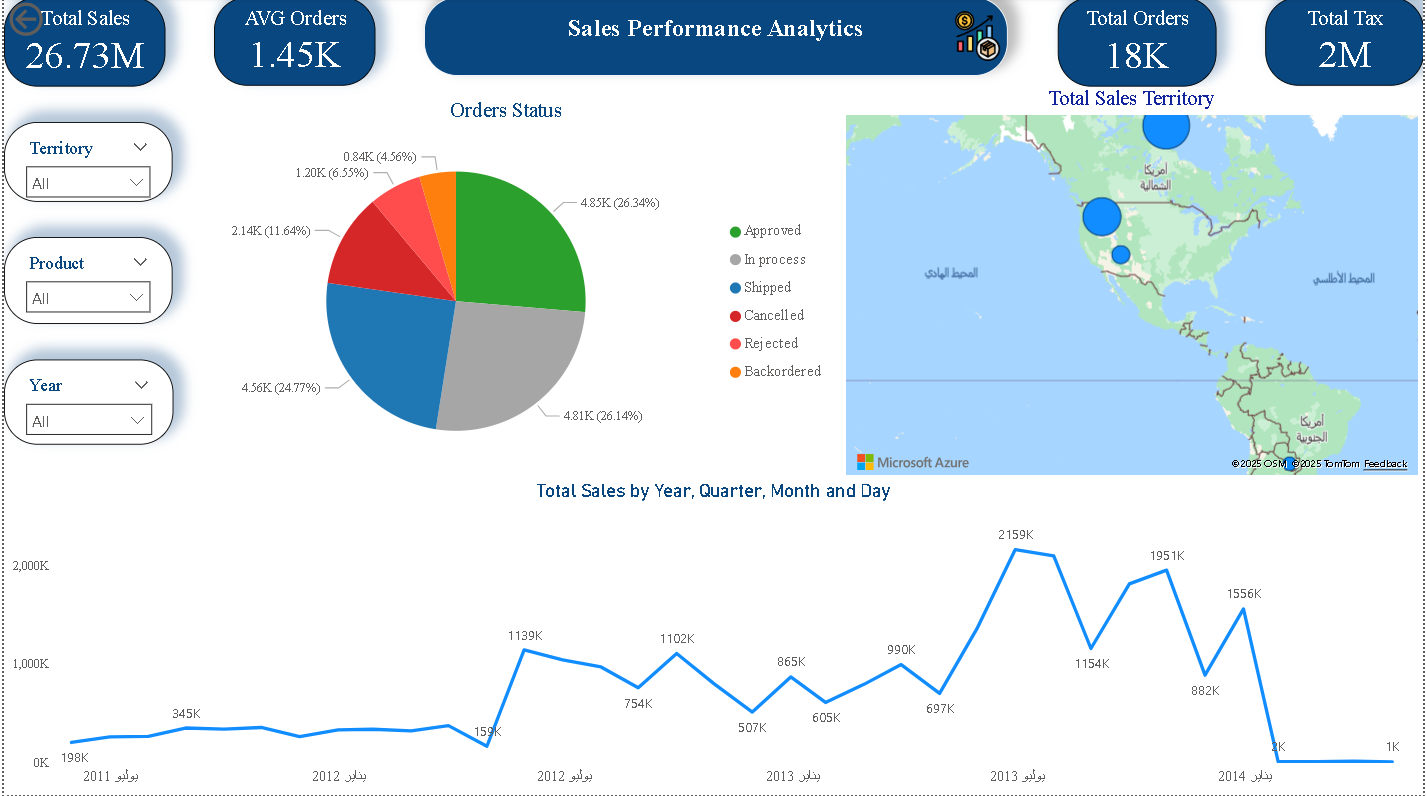
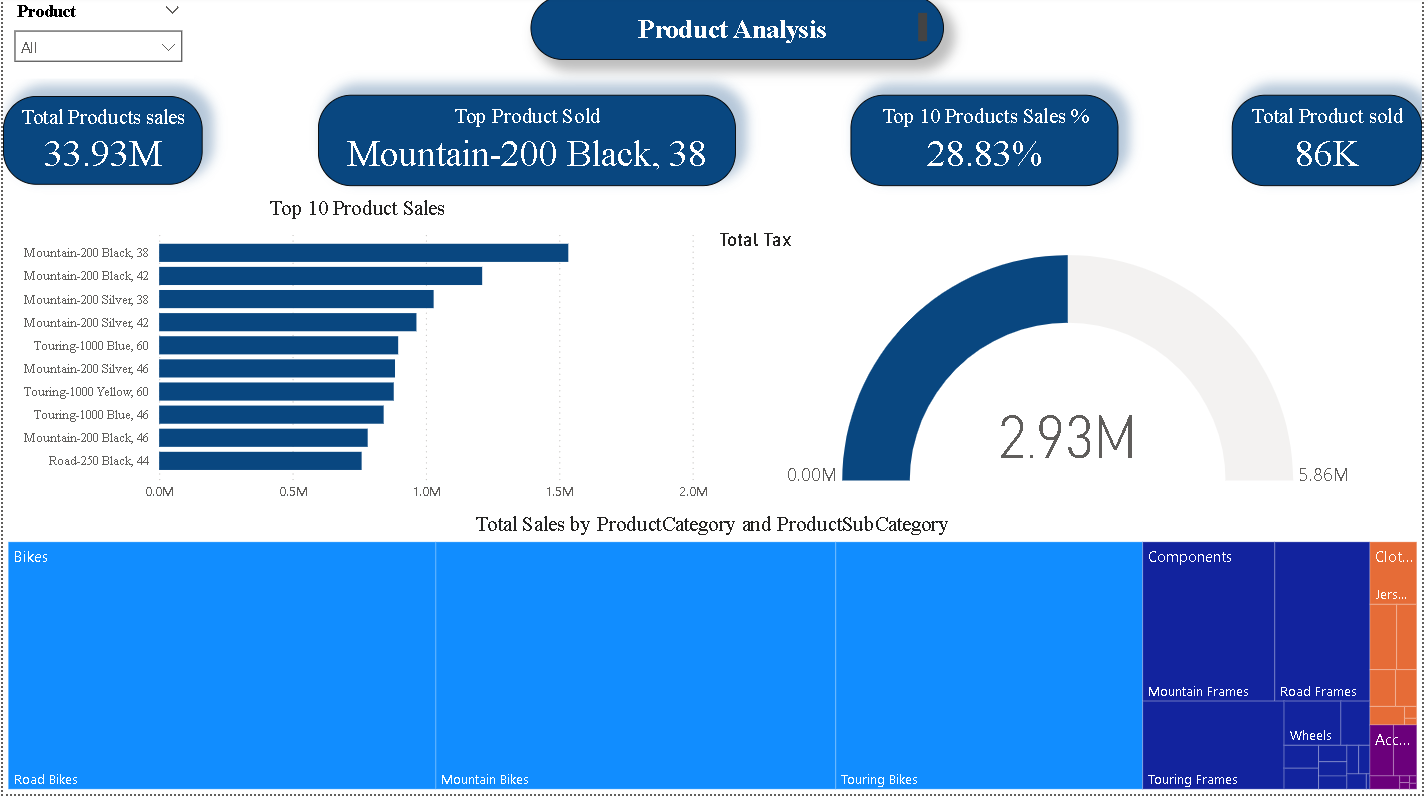
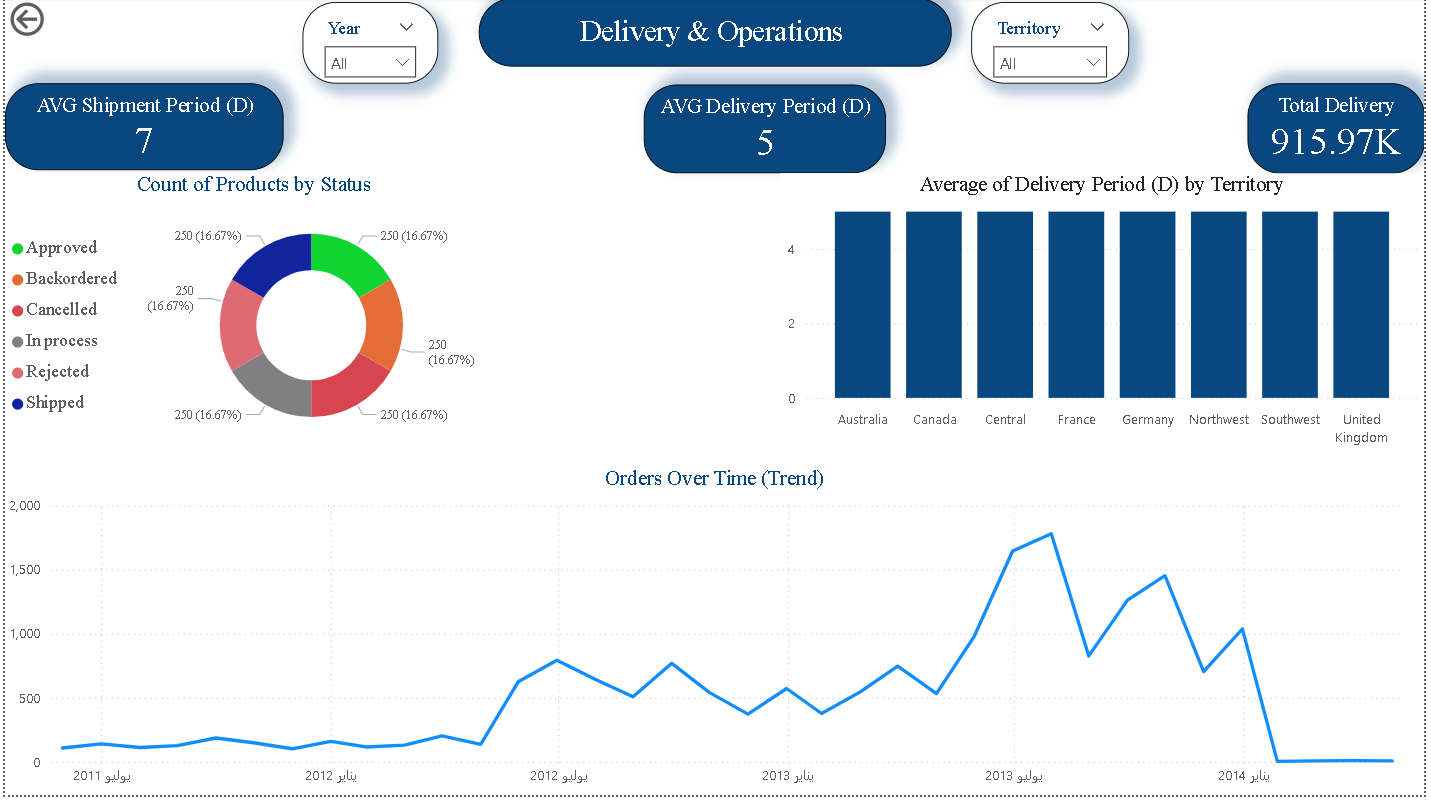
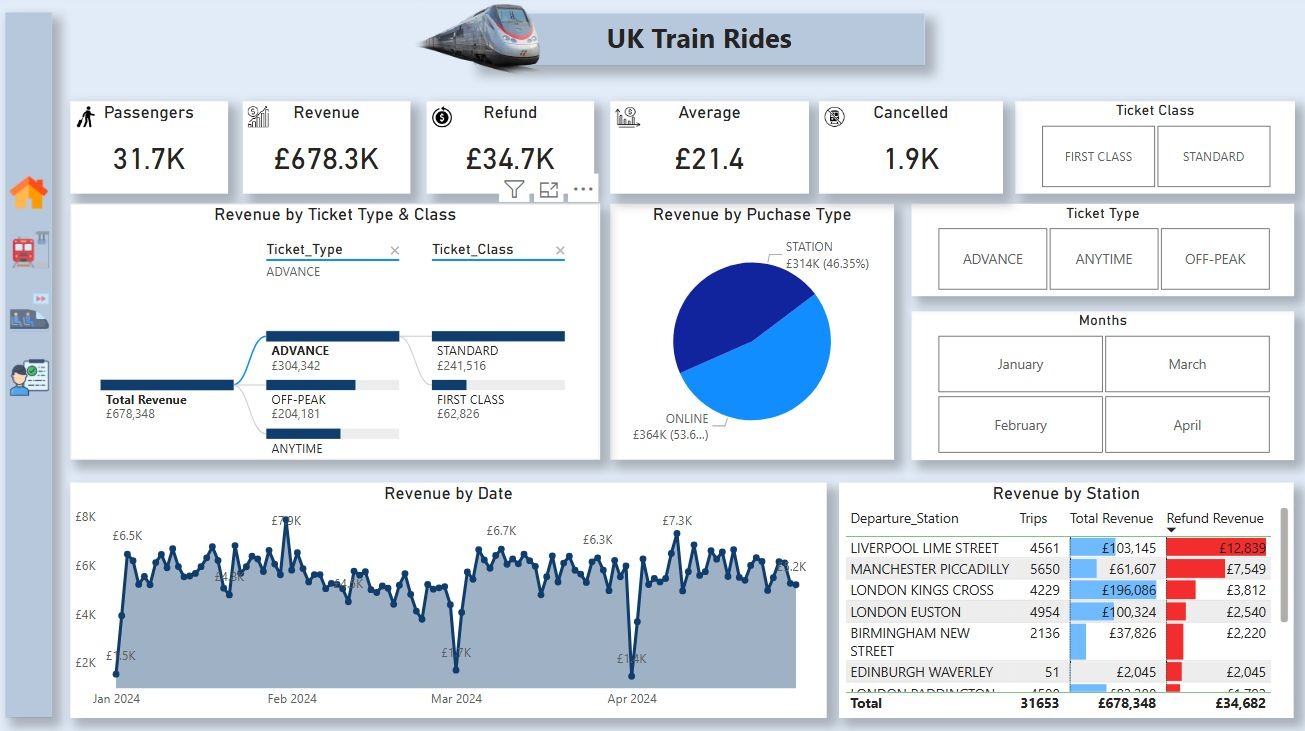
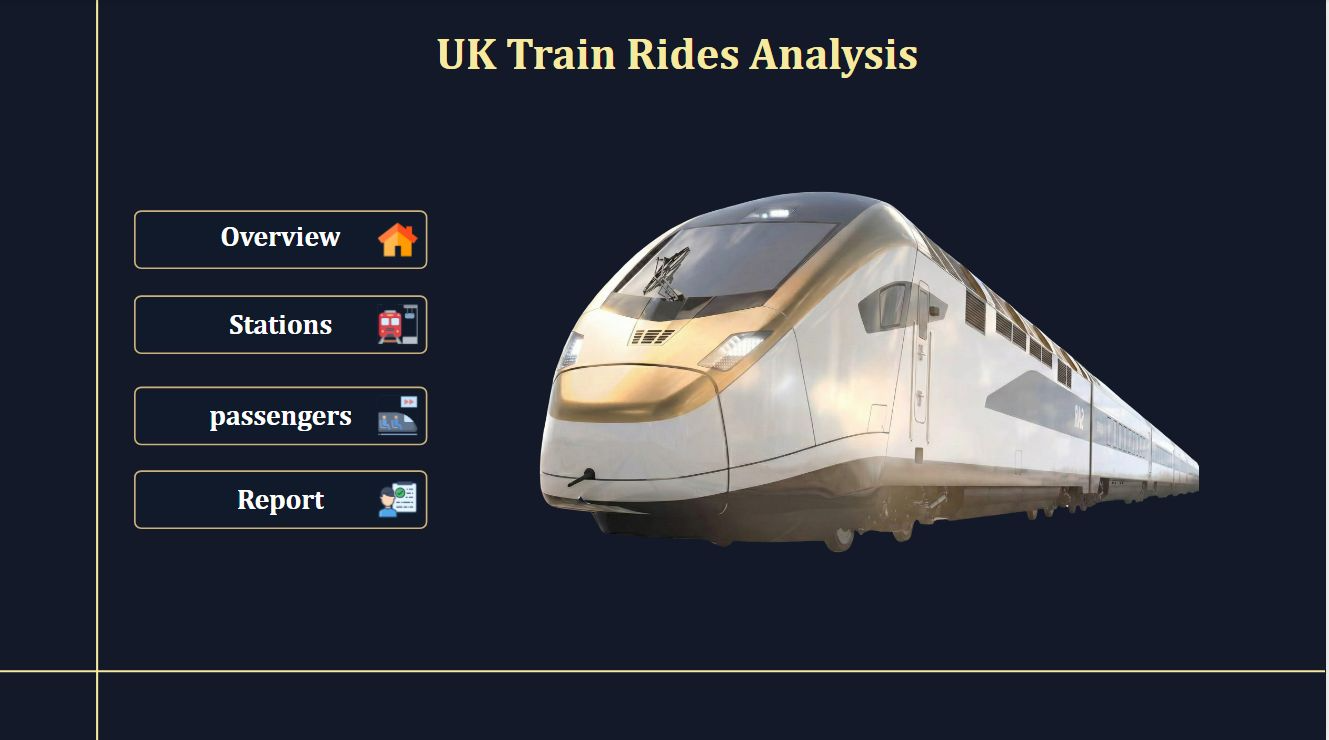
  • Power BI to build interactive, decision-ready dashboards showcasing train usage patterns, busiest routes, and seasonal trends.

The final dashboards demonstrate my skills in data preparation, modeling, and visualization to support data-driven decisions.

Power BI Excel ETL SQL Data Modeling DAX
View on GitHub

HR Employee Attrition Analysis

HR Overview Dashboard Attrition Analysis Dashboard Satisfaction and Performance Dashboard

For my Digital Egypt Pioneer Initiative, I developed an end-to-end HR Employee Attrition Analysis project using Power BI. I collected, cleaned, and transformed HR employee records to explore key metrics such as attrition rate, job satisfaction, performance score, and demographic trends. Using Power Query and DAX measures, I built three interactive dashboards that uncover the main drivers of employee turnover and highlight actionable insights for HR decision-making.

The final dashboards demonstrate my skills in data preparation, modeling, and visualization to support data-driven HR strategies.

Power BI Excel ETL Data Modeling DAX
View on GitHub

Sales Performance Analytics

sales dashboard dashboard dashboard

For my Digital Egypt Pioneer Initiative, I developed a Sales Performance Analytics to collect, clean, and analyze book data from Data Source. Using Excel,DAX measures, and Power Query ETL capturing details such as KPIs. Then I built interactive Sales Performance Dashboard using Power BIto analyze sales trends, product performance, and delivery efficiency across multiple regions.

The final data model and dashboard is showcasing my skills in data preparation, and visualization.

Excel ETL Data Modeling Power BI Stra Schema
View on GitHub

Sentiment Analysis

python python python

For my Brainwave Matrix Solutions internship, I developed a Sentiment Analysis to collect, clean, and analyze book data from Data Source. Using Python, capturing details such as Sentiments of Customers.

After collecting the raw Airline data, I applied Pandas for data cleaning: standardizing columns, removing duplicates, handling missing values, and converting prices into numerical values. I then validated the dataset and created visual insights such as Sentiment distribution

The final dataset is showcasing my skills in data preparation, and visualization.

Python Pandas Matplotlib Seaborn
View on GitHub

Ai Mathematics Tutor

image

A web app that uses AI to help students learn math. Built with HTML, CSS, and JavaScript. The app provides interactive lessons, practice problems, and instant feedback.

HTML CSS JavaScript Cursor IDE
View on GitHub

Ai Website builder

imaage

A web app builded using Cursor IDE that helps to build simple websites using AI.

The web App insures my skills in vibe coding

HTML CSS JavaScript Cursor IDE Mongo Database Next.js Nest.js
View on GitHub

University Housing Management System – Graduation Project

image

Developed a full-stack web platform to automate student housing processes, from application submission to admin approval and service access.

Led the frontend development using Angular, with backend logic implemented in Java using Spring Boot, and MySQL as the database.

Implemented authentication, role-based access control, and real-time request tracking to enhance efficiency and user experience.

Java SpringBoot Angular
View on GitHub

© 2025 Mohamed Mayhoub. All Rights Reserved.